September 20th, 2017
How to Use Big Data to Drive Product Innovation
Why Big Data Matters to Product Manufacturers, Both Large and Small
Gone are the days when you can “go with your gut.” Most major manufacturers are collecting and using Big Data in ways to improve product quality, streamline manufacturing performance, and optimize their product offerings. To compete in the 21st century, these businesses recognize they can’t just rely on gut intuition and feedback from sales to guide major investments. Instead, they must develop tools to track their products, competitors, customers, and brands. They must gather and analyze the data, then convert that business intelligence into actionable improvement and innovation.
Businesses have been using data for decades, but recent technological leaps have dramatically increased the amount and types of data they can collect and store. In a world of smartphones, smart products, and tiny, low-cost sensors, almost anything can be tracked and counted. Data sets have become so large, numerous, and complex that new techniques have to be created to manage and analyze it. And that’s where Big Data comes in.
“Big Data” refers to these massive data sets and the specialized analytic techniques being developed to process it. Compared to traditional data analysis, Big Data promises to give you more data (it tracks everyone, not just a sample), faster (often, queries can be made real time), with more variety (it combines many types of data).
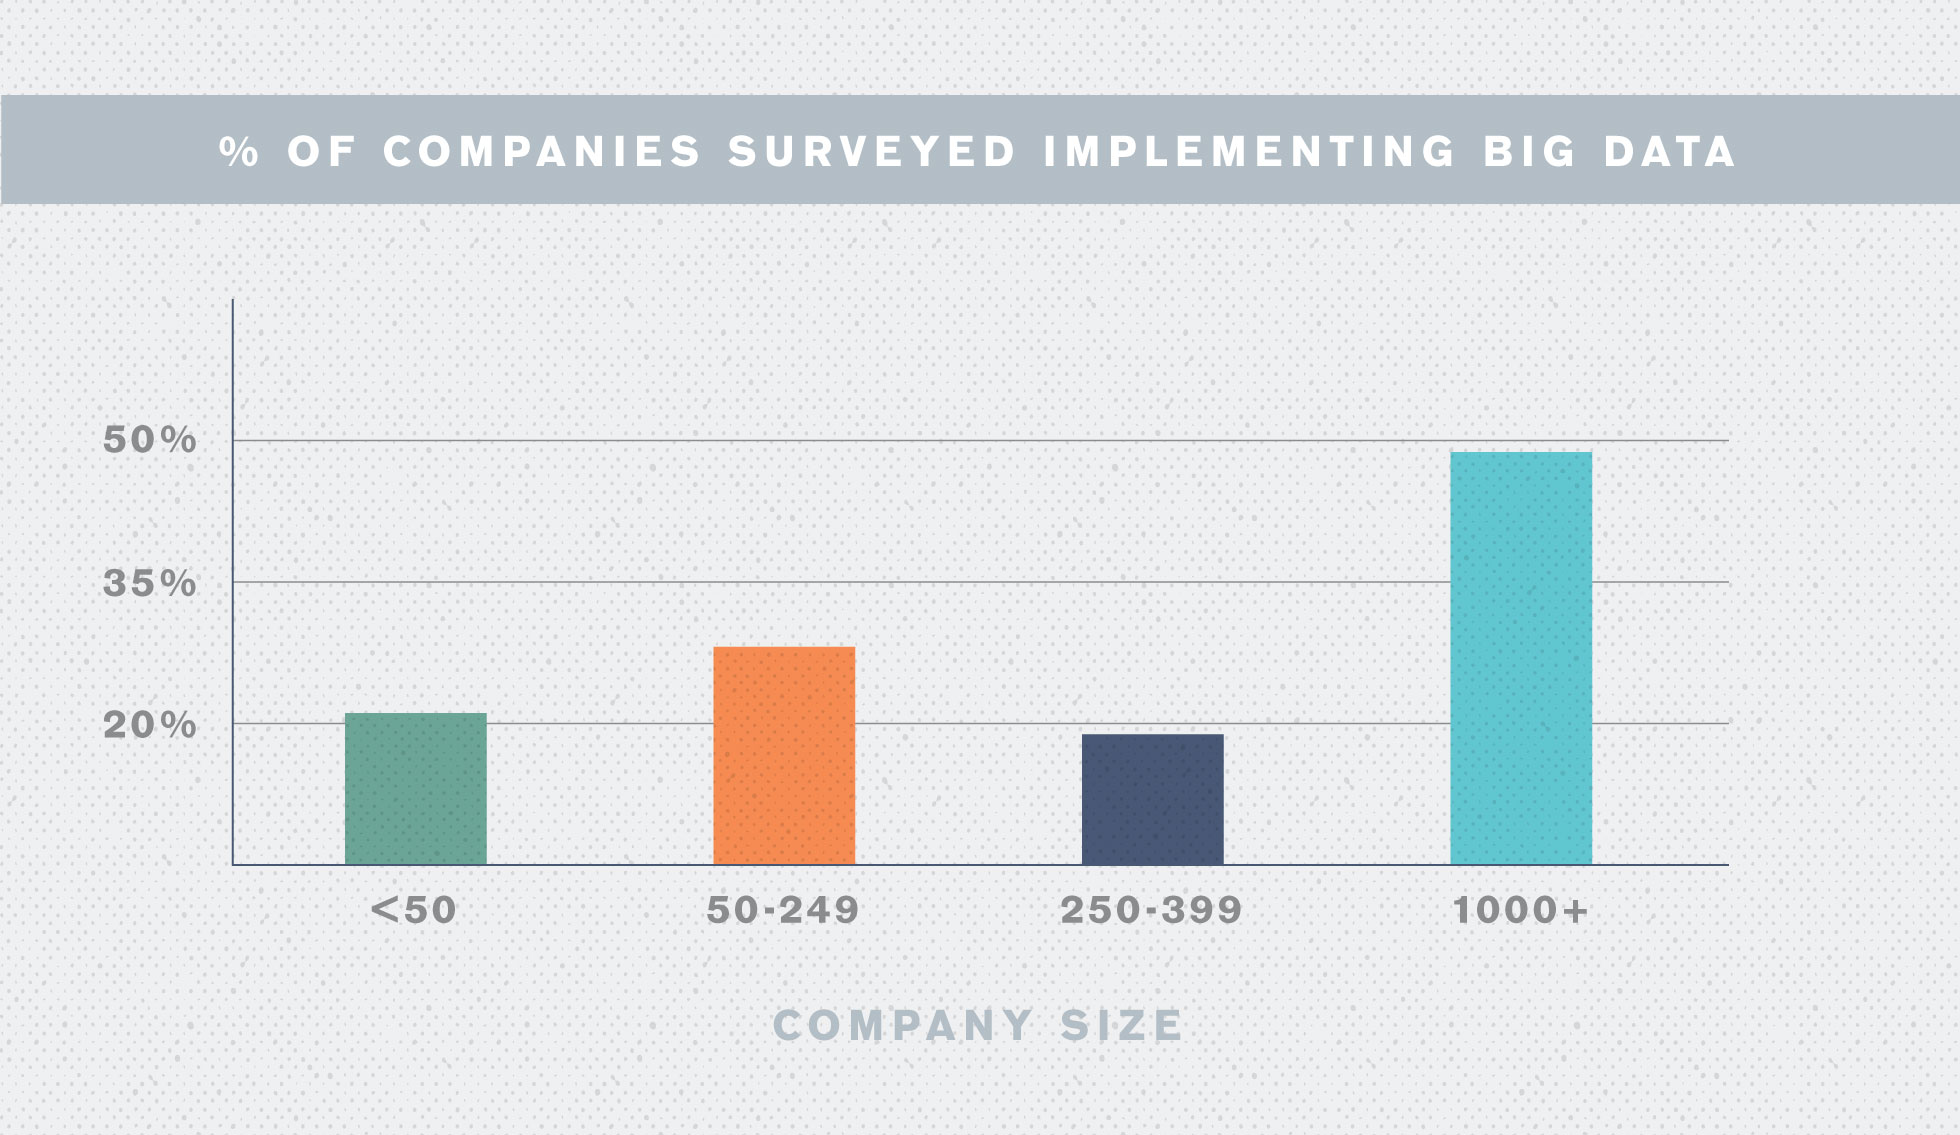
From global brands like Google and Apple to service titans like LiveNation and AirBnB, big business is drinking the big data Kool-Aid, and using it to stay ahead of smaller competitors (with their smaller databases). But ambitious startups and dynamic mid-sized manufacturers are getting smart, utilizing some surprisingly accessible data gathering techniques to build their own business intelligence, and outfox the giants.
Product manufacturers of every size are in a unique position today to gather and harness Big Data to improve their business. Working with their retail, manufacturing, and research partners, brands today should be using data to help answer these fundamental questions:
- Who are our customers / end users and what do they want?
- How can we make our product or service better?
- What gaps or opportunities exist in the market?
Whether your business is just dipping its toes into the big data waters or drowning in statistics, this paper will help you optimize your data gathering and analysis to get more useful and actionable results to fuel product innovation.
Use Data to Get to Know Your Customer
Every interaction with your customer, whether it’s through your product, website, sales, or service, can be a source of valuable data, if you know what to look for and which questions to ask. By learning about who your customers are and what makes them tick, you’ll do a better job of targeting your best, most profitable customers with products tailored to their needs and wants.
First, establish programs to continuously gather and analyze the data to which you have easy access, such as sales numbers and customer databases. Then work to discover the additional input needed to flesh things out. There are a variety of resources available today to learn more about the people who are buying your products, including web surfing habits, shopping history, hobbies, and more. And if the information isn’t available, it can be acquired with targeted research.
Combine this information with demographic data like age, sex, income, occupation, geography, etc., to build a set of customer personas. These are representative characters that embody the qualities and quirks of your various customer types. Use them to provide inspiration for each business segment as you seek to serve your customers better. And share with your creative teams to help innovate and validate new product concepts.
In this excerpt from “Use Your Data to Get a Holistic View of the Customer,” John Forese, SVP & Head of Data and Marketing Services at LiveNation, describes how his business uses consumer data to give their customers what they want and market to them appropriately:
“The data that had been collected from consumers could help us provide a holistic view of the music or sports fan for our business clients. We have transactional data about what consumers are buying, and we can enrich that with demographics and psychographics.
A football team might ask us for advice on which artist it should bring in for a performance before an event, given the likes and dislikes of its season-ticket holders. We can do that. We can also help clients find the best prospects for packages of season tickets or subscriptions to shows, and we can assist them in coming up with marketing messages that will resonate with these prospects.”
Chase the Signals
Today’s consumers live in an in increasingly virtual world, with nearly every activity and transaction recorded digitally. And with the mainstream adoption of IoT (Internet of Things) products loaded with sensors, any product can become a data collection device. That means it’s easier than ever for businesses to gather valuable data on how people use their products and behave within the product environment.
It’s no surprise then to learn that businesses today are virtually buried in data. It can be daunting to organize and analyze the reams of statistics being generated and translate them into a singular call to action. How do smart innovators derive meaning from the madness?
According to Nate Silver, celebrity statistician and founder of FiveThirtyEight.com, you have to look at the world not as a series of black and white choices, but in terms of probabilities:
“Almost all the forecasts I publish, in politics and other fields, are probabilistic. Instead of spitting out just one number and claiming to know exactly what will happen, I instead articulate a range of possible outcomes.” —Nate Silver, The Signal and The Noise
It can be tempting to ask your research teams to provide definitive, actionable directives. But data analysis is a science, and science can be messy. Hypotheses must be generated and tested. Sometimes that means asking new questions or using new discovery techniques. Often the data contradicts internal wisdom and intuition and must be reconciled. Signals (meaningful trends or market insights) can be difficult to separate from noise (outlier or red-herring data inconsistent with the greater trends).
To take advantage of a potential opportunity, you have to “chase the signal”. If something shows up in your data that looks like an unrealized opportunity, describe a question that can be answered with data, and go out and get the answer. For example, let’s say you’re a snowboard maker and Big Data is showing that purple was the fastest growing color in men’s fashion in 2016. No one sells a men’s snowboard in purple today. Should you offer your newest snowboard models in purple for 2017?
With that question in hand, your data analysts and product researchers can get to work. Look at sales figures for purple products in related product categories. Use online shopping data to learn what colors of winter gear and accessories your customers are buying. Finally, if the data supports further signal chasing, place small runs of purple snowboards at select retailers and online and track customer interest.
Be prepared to chase new leads and signals as the data comes in. What if the data shows that sales are up for hats and accessories in unique colors, including purple, but neutral colors still rule for big ticket items like snowboards, kayaks, and bicycles? With these new signals, you will discover new questions to ask: Do consumers make different color choices based on price level? Are consumers hesitant to purchase big ticket items in trendy colors, lest they go out of style too quickly? The assumptions you derive from data should be tested and data gathered on those assumptions.
Be Creative About the Places You Gather Your Data
For Big Data to stimulate creative thinking, you have to be creative about where you get it. Traditional data sources, like sales statistics, customer feedback surveys, etc., can be supplemented with other sources to answer tricky questions:
- 3rd party consumer data can help flesh out customer profiles with demographics, browsing and shopping habits, etc.
- Ask your retailers and manufacturing partners to share relevant sales and customer data.
- Track returns and warranties to identify product problems.
- Design future products with sensors to collect product usage data.
- Online product reviews (both yours and competitors’) can provide valuable feedback for product fixes, improvements, and new features.
- Use social media for “social listening” to hear the voice of your customer, and spot trends and themes needing further exploration.
No data source should stand alone. Information gathered from each source should be correlated, analyzed, and interpreted with other streams of data to paint a full picture. This broader outlook will yield a case and narrative for future innovation.
Supplement Big Data With Qualitative Data to Give It Meaning and Story
Big Data is essentially a massive collection of quantitative data. In other words, statistical information that can be counted or measured. New tools and technologies have vastly increased our ability to gather, store, analyze, and visualize this data. And that’s led to breakthroughs in business efficiency and optimization. But it has also led to some big misunderstandings. It is important to recognize the value, and the limitations, of Big Data.
Big Data can only show you things that can be measured. Studies built from sales reports and customer databases lack a narrative quality that can be critical to moving ideas through the development process. It is imperative that product innovators supplement their big (quantitative) data with qualitative information to flesh out the emotional, aspirational, and environmental aspects that put the data in context. Big Data shows you the “What”, while qualitative methodologies like ethnographic research answer “Why”.
The triumph of data in Major League Baseball (MLB) was famously documented in the book “Moneyball,” by Michael Lewis, where the statistically minded Billy Beane of the Oakland Athletics triumphed over MLB scouts from richer clubs, who relied on more qualitative attributes like “attitude” and “work ethic” to make their picks.
But in his book “The Signal and the Noise”, Nate Silver proves (with data) that neither is best. He conducted a study to compare his own, data-based scouting algorithm against qualitative-based predictions, as well as against a third hybrid approach. The hybrid approach combined quantitative statistics with qualitative input from seasoned scouts.
In study after study, the hybrid approach proved to be the best predictor of a prospective player’s success. The lesson is simple: product innovators should combine insights from Big Data and qualitative research to build a complete picture of their customers and the future of their business.